
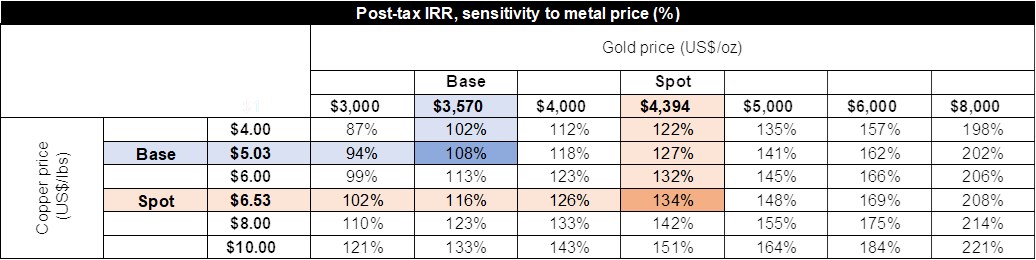
Meridian Mining's Definitive Feasibility Study for Cabaçal Delivers After-Tax NPV5 of USD 2.09 Billion, 108% IRR, and 0.9 Year Payback Cabaçal DFS's Highlights
(All amounts are in United States Dollars unless otherwise stated)
Meridian reports economics from Cabaçal's Definitive Feasibility Study;
| Cabaçal DFS After-Tax outputs | Base Case Economics $3,570 Au / $5.03 Cu / $50.17 Ag | Spot Price Economics* $4,394 Au / $6.53 Cu / $64.14 Ag |
|---|---|---|
| Net Present Value @ 5% | USD 2.092 Billion | USD 2.902 Billion |
| Internal Rate of Return | 107.6.% | 134.7% |
| Payback Period | 0.9 Year | 0.7 Year |
| NPV /Capex 5 | 6.5x | 9.0x |
*Spot metal prices dated on London close, 10 September 2026
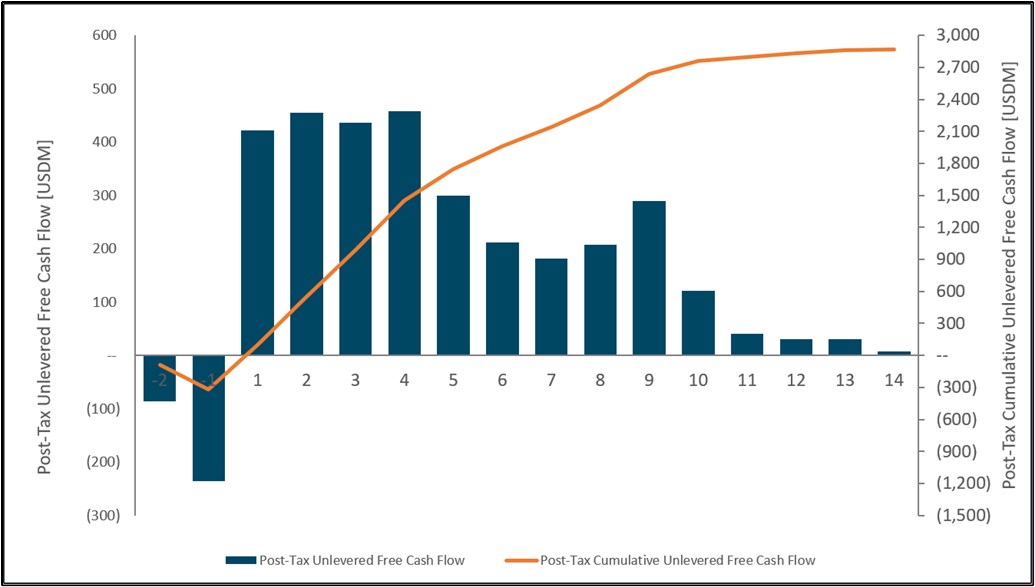
Base Case Total LOM Revenue USD 5.4 billion and LOM After-Tax Free Cash flow of USD 2.9 billion;
Life of Mine All-In-Sustaining-Costs ("AISC") of USD 1,056/oz AuEq1;
First production years 1-5:
- Average annual production of 183,526 AuEq;
- AISC of USD 715/oz AuEq;
- Average annual after-tax free cashflow of USD 413.8 million;
Initial Capital Expenditure of USD 322M includes 10% contingency, tax credits and pre-investment for expansion to 4.5mtpa from year 4 onwards;
Offsite civil works for mine commenced:
- Installation Licence for power line construction granted.
1 See Technical Note for AuEq equation.
London, United Kingdom--(Newsfile Corp. - September 22, 2026) - Meridian Mining plc (LSE: MNO) (TSX: MNO) (FSE: N2E0) (Tradegate: N2E0) (OTCQX: MRRDF) ("Meridian" or the "Company") is pleased to announce the results of the Definitive Feasibility Study (the "DFS" or the "Study") for the Cabaçal gold-copper-silver deposit in Mato Grosso, Brazil ("Cabaçal" or the "Project").
Meridian will host a Live Webcast to discuss the Cabaçal DFS Results on September 22nd, 2026 at 3:00pm UK, 10:00 am EST. A presentation by management will be followed by Q&A. Conference Call Webcast details:
Webcast URL: https://www.investormeetcompany.com/meridian-mining-plc/register-investor
Mr. Gilbert Clark, CEO, comments: "What a tremendous result has been achieved. The DFS delivered a NPV5 exceeding two billion dollars, an IRR over one hundred percent and a payback of less than one year. Our NPV5 to Capex ratio of 6.5 times is a testament to the compelling economic potential of the Cabaçal project. Using spot prices these all get better again. Reading these numbers, it elevates Cabaçal to potentially be the next "near-term" VMS gold-copper mine developed globally. Importantly, the study is based on a conservatively engineered mine design, that can be financed and built. Congratulations to the team for delivering a tremendous result.
I want to thank all our shareholders and stakeholders, without your support, we could not have delivered these remarkable results that unlock tremendous value.
Meridian is already well on the path to building Cabaçal. Preconstruction investments are underway on multiple fronts with committed capital contracts of USD 15.9 million. Installation licence permitting has been lodged, and financing activities to construct Cabaçal are progressing. Developing the next nearterm VMS Au-Cu-Ag mine of South America is a tremendous opportunity. Combine this with a highly prospective exploration portfolio and you have an incredibly compelling mining investment opportunity."
Summary of Cabaçal Definitive Feasibility Study Results
The DFS for Cabaçal was completed by Ausenco do Brasil Engenharia Ltda and Ausenco Engineering Canada ULC (together "Ausenco"), supported by GE21 Consultoria Mineral Ltd ("GE21"). The Study findings show that Cabaçal has industry-leading economics for a conventional open-pit mine, mill, and process plant. Cabaçal's ore produces a clean, high-grade Cu + Au-Ag concentrate that easily convert to high-grade blister copper in standard flash furnaces. The DFS supersedes Cabaçal's March 2025 Preliminary Feasibility Study ("PFS")1. Key updates reported in the Study include stronger economics, an updated and larger Mineral Reserve statement, an optimised mine plan, and improved metallurgy.
Table 1: Summary of Cabaçal DFS's NPV5 sensitivities to gold and copper prices (silver at Base Case)
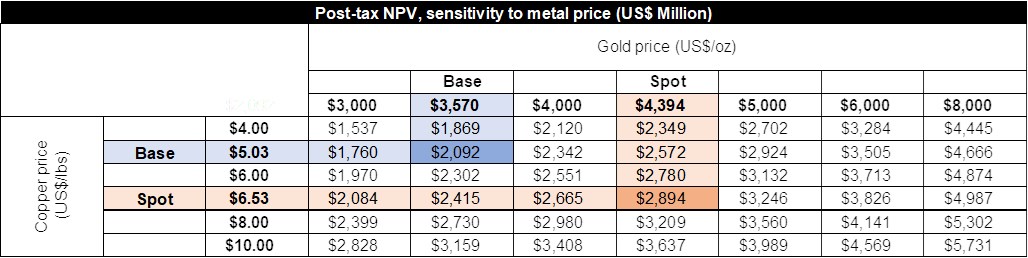
Table 2: Summary of Cabaçal DFS's IRR sensitivities to gold and copper prices (silver at Base Case)
| Item | LOM | |
| Plant Feed Mined Waste Mined Total Mined Strip Ratio Milled tonnes Mill Throughput | Mt Mt Mt Waste:Mineralised Ore Mt Mt/annum | 56.0 79.3 135.4 1.4 56.0 2.5 to 4.5 (year 4 on) |
| Item* | LOM | |
| Total gold production Total copper production Total silver production Average metallurgical recovery - Gold Average metallurgical recovery - Copper Average metallurgical recovery - Silver | ounces tonnes ounces % % % | 983,537 180,634 1,779,720 89.3% 92.8% 74.3% |
| Item | LOM | |
| Average annual gold production (AuEq) Recovered Gold (AuEq) Total Cash Cost Sustaining capital All in Sustaining Costs ("AISC") | 000 Ounces 000 Ounces USD/oz AuEq USD/oz AuEq USD/oz AuEq | 112.9 1,569.6 982.9 49.3 1,056.0 |
Table 3: DFS production summary. * The production numbers may differ from reserves estimates when using average metallurgical recovery due to different calculation methodologies.
| Item | Base Case | Spot Case | |||
|---|---|---|---|---|---|
| Life of mine Years NPV USD million 5 IRR % Payback Year Initial Capital Expenditure* USD million Expansion Capital Expenditure* USD million Sustaining Capital Expenditure USD million | 13.9 2,092 108% 0.9 322 56 74 | 13.9 2,902 135% 0.7 322 56 74 | |||
| *Net of Tax credits | |||||
| Item | Average Year 1- 5 | Total LOM | Average Year 1- 5 | Total LOM | |
| Revenue | USD million | 629 | 5,358 | 787 | 6,727 |
| Operating Costs | USD million | 92 | 1,256 | 92 | 1,256 |
| Free cash (After Tax) | USD million | 414 | 2,867 | 542 | 3,975 |
Table 4: Project economics at base case and spot case
| Item | Base Case | Spot Case |
| Gold Price USD/oz Copper Price USD/lb Silver Price USD/oz Exchange Rate BRL:USD Corporate Tax Rate % Social Tax % SUDAM Tax Reduction % SUDAM Tax Reduction Years Gold Royalty Rate % Copper Royalty Rate % Silver Royalty Rate % | 3,570 5.03 50.17 | 4,394 6.53 64.14 |
| 5.40 25.0% 9.0% 75.0% 10 1.5% 2.0% 2.0% |
Table 5: Cabaçal DFS model inputs
Figure 1: Cabaçal project annual and cumulative Base Case cash flow
| Cabaçal Capital Costs | |
|---|---|
| Initial Costs | USD million |
| Mine Process Piles Offsite Infrastructure Indirect Costs (including Owner costs) Contingency Tax Credit | 31 156 52 21 52 31 (21) |
| Total Initial Capital | 322 |
| Expansion Capital | 56 |
| Sustaining Capital | 74 |
| Mine Closure Costs | 59 |
| Salvage Value | (23) |
Table 6: DFS capital cost breakdown
| Cabaçal Operating Costs Breakdown | ||
|---|---|---|
| Item | USD/t milled | USD/oz AuEq |
| Mining Costs Labour Power Reagents & Consumables Maintenance Water/sewage Road maintenance Laboratory Concentrate Logistics Tax Credit G&A | 9.93 1.48 2.69 4.06 1.05 0.11 0.10 0.35 2.20 (1.88) 2.32 | 370.76 55.12 100.29 151.77 39.19 4.23 3.71 13.11 82.08 (70.04) 86.56 |
| Total Operating Costs | 22.41 | 836.79 |
Table 7: DFS operating cost breakdown
Study Contributors
The DFS team was led by Ausenco, a global provider of consulting and engineering services for mining projects. Ausenco were supported by GE21 Consultoria Mineral Ltda (resource and reserve estimation, mine plan and schedule), SGS Lakefield Canada (metallurgy) and Flowsheets Metallurgical Consulting Inc (metallurgy and mineral processing).
Resource Development Studies
The mineral resource for Cabaçal (Table 8) was classified and prepared in accordance with the Canadian Institute of Mining, Metallurgy and Petroleum (CIM) Definition Standards for Mineral Resources and Mineral Reserves, adopted by the CIM Council on May 10, 2014, as amended (the "CIM Standards"), and the CIM Estimation of Mineral Resources and Mineral Reserves Best Practice Guidelines, adopted by the CIM Council on November 29, 2019, as amended (the "CIM Guidelines") by Mr. Leonardo Moraes Soares, MAIG. Mr. Soares is an independent Qualified Person, as such term is defined under NI 43-101. The mineral resource was previously announced by Meridian on January 20, 2026, and is unchanged.
| Classification | Weathering | Mass Mt | Average Value | Material Content | ||||
|---|---|---|---|---|---|---|---|---|
| Au g/t | Ag g/t | Cu % | Au koz | Ag koz | Cu kt | |||
| Measured | Saprolite | 0.33 | 0.44 | 0.69 | 0.12 | 4.56 | 7.22 | 0.38 |
| Transition | 1.83 | 0.55 | 0.63 | 0.21 | 32.60 | 37.25 | 3.81 | |
| Fresh Rock | 62.53 | 0.57 | 1.36 | 0.35 | 1,138.52 | 2,743.29 | 217.43 | |
| Total | 64.69 | 0.57 | 1.34 | 0.34 | 1,175.68 | 2,787.77 | 221.61 | |
| Indicated | Saprolite | 0.01 | 0.30 | 0.99 | 0.16 | 0.14 | 0.46 | 0.02 |
| Transition | 0.07 | 0.13 | 0.59 | 0.22 | 0.31 | 1.37 | 0.16 | |
| Fresh Rock | 5.32 | 0.49 | 1.00 | 0.22 | 83.09 | 170.77 | 11.69 | |
| Total | 5.41 | 0.48 | 0.99 | 0.22 | 83.54 | 172.59 | 11.87 | |
| Total | Saprolite | 0.34 | 0.43 | 0.70 | 0.12 | 4.70 | 7.68 | 0.40 |
| Transition | 1.90 | 0.54 | 0.63 | 0.21 | 32.91 | 38.62 | 3.96 | |
| Fresh Rock | 67.85 | 0.56 | 1.34 | 0.34 | 1,221.61 | 2,914.06 | 229.12 | |
| Total | 70.10 | 0.56 | 1.31 | 0.33 | 1,259.22 | 2,960.36 | 233.48 |
Table 8: Cabaçal deposit mineral resource table.
Notes related to the Mineral Resource Estimate ("MRE"):
1. Measured and Indicated Resource estimate reported inside open-pit constraints. Inferred category was not classified inside open-pit constraints.
2. The Mineral Resource Estimates were prepared in accordance with the CIM Standards, and the CIM Guidelines, using geostatistical and/or classical methods, plus economic and mining parameters appropriate to the deposit.
3. Mineral Resources are not Mineral Reserves and are not demonstrably economically recoverable.
4. Grades are reported using dry density.
5. The effective date of the MRE was December 31, 2025.
6. The QP responsible for the Mineral Resources is geologist Leonardo Soares (MAIG #5180).
7. The MRE numbers provided have been rounded to the estimate's relative precision. Values cannot be added due to rounding.
8. The MRE is delimited by Mining tenement areas.
9. The MRE was estimated using ordinary kriging in 5m x 5m x 2.5m blocks with sub-blocks of 2.5m x 1.25m x 0.625m.
10. The MRE report table was produced in Leapfrog Edge software.
11. The MRE was restricted by a pit shell defined using metal prices of USD 3,103/oz Au, USD 35.34/oz Ag, USD 4.39/lb Cu, mining cost of USD 2.95/t mined, processing cost of USD 7.82/t processed, metallurgical recovery calculated block by block based on metallurgical tests, G&A costs of USD 2.19/t processed, and USD 2.36/t processed logistics.
12. Equivalent Gold grade ("AuEq") was calculated with the following general formula: AuEq = (Au_grade * %Au_Recovery) + (0.970* (Cu_grade * %Cu_Recovery)) + (0.013*(Ag_grade * %Ag_Recovery)).
13. The QP is not aware of political, environmental, or other risks that could materially affect the potential development of the Mineral Resources other than those typical for mining projects at this stage of development.
14. The resource cut-off grade applied for Measured and Indicated resources was 0.117 g/t AuEq.
15. The underground mining void model has been used to deplete the resource.
The mineral exploration data was applied to define the 3D geological model and resource estimate. It was compiled into Leapfrog software for the audit and validation of the organisation, integrity, and security of the data. The database is considered suitable for the purposes of Mineral Resource estimation.
The Cabaçal deposit mineral resource database consists of 1,290 drillholes, 34 trenches, 83 channels, 25 auger drillholes, 15 mixed drillholes, 13 percussion drillholes and 12 rotary percussion drillholes (Meridian + historic drilling), totalling 139,956.78 metres. This database includes 96,900.22 metres of assayed intervals.
All historic data used for the MRE has been validated statistically to show no significant bias, by twinned drillholes, extensive re-sampling and assaying of historic drill core, statistical comparison of historical data with Meridian drilling, and field validation of collar locations.
The 3D geological model was prepared by the QP using Leapfrog Geo software, to define and interpolate geological domains.
The nominal sample length of 1 m was selected to be used in sample compositing based on the analysis of composite support for the Cabaçal deposit. The variograms prepared for each domain were used in Ordinary Kriging for Au (g/t), Cu (%) and Ag (g/t) estimates, using Leapfrog Edge software.
The block model for the Cabaçal Project was built using Leapfrog software. The blocks have dimensions of 5m x 5m x 2.5m, with sub-blocks of 2.5m x 1.25m x 0.625m.
Density data was supplied by Meridian inside the drillhole database with selected intervals of 10-15 cm in length for weathered samples and 1 metre for fresh material. A total of 70,976 density test results is present in the database. The QP assumed a fixed value of 2.16 t/m³ for average density on Saprolite and 2.54 t/m³ for the Saprock horizon, based on statistical analysis. Density in the fresh-rock zone was estimated by inverse-distance weighting, using a minimum of 5 and a maximum of 15 density sample values.
The Ordinary Kriging (OK) estimation method was applied to estimate the Au (g/t), Cu (%) and Ag (g/t) grades for mineralised domains. The estimates were separated for each domain, respecting the composites of each of the mineralised horizons. Grades were estimated considering Soft Boundary domains.
The classification of mineral resources for the Cabaçal deposit was determined by the QPs using the definitions of the Resources established by the CIM. This process involved assessing data quality and quantity, and resource classification was also based on search pass numbers used in grade interpolation.
The Mineral Resource value was quantified inside a resource pit based on the current cost and assumed commodity price, represented for the Reasonable Prospect for Eventual Economic Extraction (RPEEE), with an effective date of December 31, 2025.
Mineral Resources were classified based on the estimation search radius, in conjunction with geological continuity, data spacing, and confidence in the grade estimates. Distances of up to 55 metres were assigned to Measured Mineral Resources, and up to 80 metres to Indicated Mineral Resources.
There were no blocks classified as Inferred within the open-pit shell.
The resource cut-off grade applied for low- and high-grade domains in Measured and Indicated resources was 0.117 g/t AuEq.
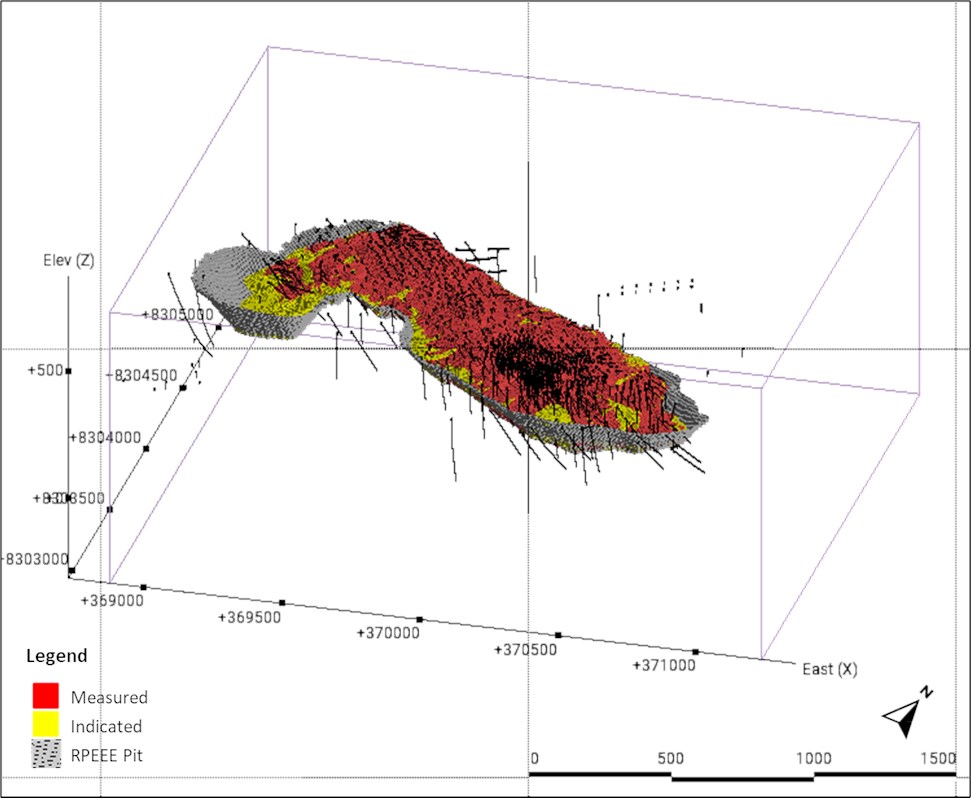
Figure 2 presents the equivalent gold grade within the block model and the RPEEE pit shell, while Figure 3 shows the mineral resource classification.
Figure 2: Gold Equivalent grade within the block model for Cabaçal and the pit optimised for Reasonable Prospects for Eventual Economic Extraction ("RPEEE").
To view an enhanced version of this graphic, please visit:
https://images.newsfilecorp.com/files/7354/315328_37c5e3dcd40e6b43_004full.jpg Figure 3: Mineral Resource Classification for Cabaçal
Whilst the DFS resource has increased from that issued for the PFS, the Company notes that the Preliminary Licence for the development footprint of Cabaçal is approved for the volumes of material aligned with those established in the PEA2 and PFS. An increase in the volumes of mined material would require amending the Preliminary Licence, thus extending the Cabaçal development timeline. As a result, the Company will continue to base its initial development plans on the footprint defined by the Preliminary Licence pit and waste dump areas. Future possibilities may include an expansion of the open pit, implementing backfilling within the approved pit footprint, or potential underground exploitation. The Company will continue to assess near-mine exploration opportunities. The down-dip and downplunge extensions of the Cabaçal mineral system remain lightly drilled. It may be that local flexures or structural intersections, or periodicity in the original VMS architecture, create favourable positions for the copper-gold mineralisation event, with scope to test for underground targets. The Company will progressively test for vectors to potential underground resource extension targets.
Geochemical and geophysical programmes remain active in the mine corridor and the Company has purchased drone-based geophysical sensors to add further to our in-house capabilities for better mapping the structure and stratigraphy for exploration targeting.
Technical Notes
The CIBC Analyst Consensus Commodity prices of November 2025 have been used for the Mineral Resource Estimates: Gold USD 3,103/oz, Silver USD 35.34/oz, Copper USD 4.39/lb, Zinc USD 1.22/lb, and Lead USD 0.92/lb. Metallurgical recoveries have been based on test work programmes undertaken on drill core at SGS Lakefield in Canada, determining the following parameters:
Cabaçal Fresh Rock Gold Recovery:
Recovery for grades less than 0.5g/t Au = 5.4022∗ Ln(Grade)+88.66
Recovery for grades equal to or higher than 0.5g/t Au = 5.807∗(Grade)+85.11
Recovery for grades higher than 1.65g/t Au is capped at 94.69%
Cabaçal Fresh Rock Copper Recovery:
Recovery for grades less than 0.5% Cu = 3.9067∗Ln(Grade)+95.269
Recovery for grades equal to or higher than 0.5% Cu = 1.3393∗ Ln(Grade)+97.83
Recovery for grades higher than 1.03% Cu is capped at 98.1%
Cabaçal Fresh Rock Silver Recovery:
Recovery for grades less than 0.5g/t Ag = 30.354∗Ln(Grade)+43.691
Recovery for grades equal to or higher than 0.5g/t Ag = 3.8821∗(Grade)+67.406
Recovery for grades higher than 5.0g/t Ag is capped at 86.81%
Cabaçal (Saprock) Transition Zone:
For all blocks that contain more than 0.1% sulphur, the fresh rock recovery formula would apply For all blocks containing less than 0.01% sulphur, the oxide recovery would apply
Between 0.01% and 0.1% sulphur, a pro-rata adjustment of the fresh-rock recovery formula was applied to copper
Between 0.01% and 0.1% sulphur, a recovery of 77.3% was applied to gold, and a recovery of 40% was applied to silver
Cabaçal Saprolite (Oxide) Zone:
Gold: 62.1% recovery
Copper: 1.2% recovery
Silver: 17.9% recovery
Cabaçal Metal Equivalent Formulas:
AuEq (g/t) = (Au (g/t) * %Rec.) + (0.970 * Cu (pct) * %Rec.) + (0.011 * Ag (g/t) * %Rec.)
Cabaçal Reserve Estimate
| Reserve Classification | Average Value | Material Content | |||||
|---|---|---|---|---|---|---|---|
| Mass | Au | Ag | Cu | Au | Ag | Cu | |
| (Mt) | (g/t) | (g/t) | (%) | (koz) | (koz) | (Mlb) | |
| Proven | 54.91 | 0.62 | 1.33 | 0.35 | 1,096.3 | 2,351.5 | 423.7 |
| Probable | 1.13 | 0.28 | 1.00 | 0.25 | 10.2 | 36.3 | 6.23 |
| Total | 56.04 | 0.61 | 1.33 | 0.35 | 1,106.5 | 2,388.0 | 429.9 |
Table 9: Cabaçal Copper-Gold Project - Mineral Reserves Estimate (Effective Date - December 31,2025)
Notes:
1. Mineral Reserves estimates were prepared in accordance with the CIM Standards (May 2014).
2. Mineral Reserves represent the economically mineable portion of Measured and Indicated Mineral Resources.
3. The estimate was prepared by Porfírio Cabaleiro, BSc (Mining Engineering), FAIG, FAusIMM, a Qualified Person as defined by NI 43-101
4. The effective date of the Mineral Reserve estimate is December 31, 2025.
5. The reference point is the delivery of ore to the primary crusher.
6. Mineral Reserves were estimated using GEOVIA Whittle software and were constrained within the PFS pit shell.
7. Geometric and economic first pass parameters include:
Mining recovery: 97% Dilution: 3% Metal prices: USD 3,103/oz Au, USD 35.34/oz Ag, USD 4.39/lb Cu Mining cost: USD 2.95/t mined Processing cost: USD 7.82/t milled G&A: USD 2.19/t milled Logistics: USD 2.36/t milled Exchange rate: 1 USD = 5.60 BRL Metallurgical recoveries: 89.11% Cu, 78.49% Au, 47.13% Ag Strip ratio: 1.42
Mining
10-year open-pit mining period, followed by stockpile reclaim to support a 14-year processing period, with a total plant feed inventory of 56.04 Mt;
Year 1 mill feed grades of 2.8 g/t Au, 0.71% Cu and 2.69 g/t Ag, compared to average life-of-mine (LOM) grades of 0.61 g/t Au, 0.35% Cu, and 1.33 g/t Ag; and
Low life-of-mine strip ratio of 1.42.
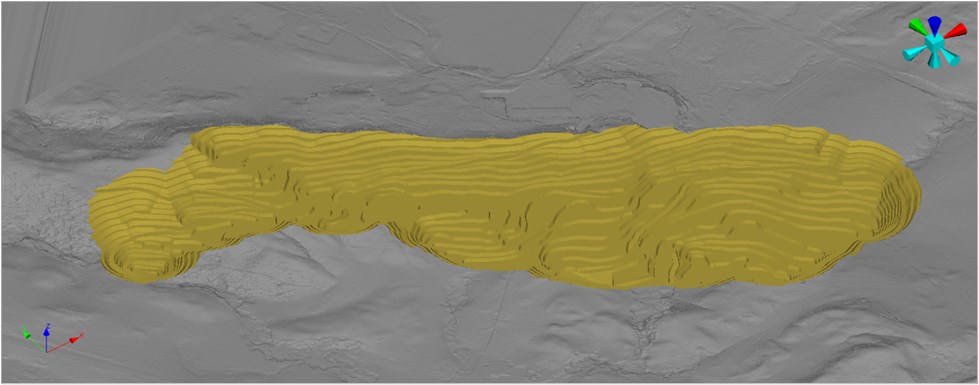
Cabaçal will be mined using conventional open-pit methods (Figure 4), operating 24 hours per day, 365 days per year, using three alternating shifts. Mining activities, including pre-stripping, are scheduled over approximately 10 years, while processing will continue for a total of 14 years through the reclaim of previously stockpiled ore. The mining schedule was developed to provide sufficient RoM ore to support a nominal processing capacity of 1.93 Mtpa in Year 1, increasing to 2.50 Mtpa in Years 2 and 3, and to 4.50 Mtpa from Year 4 onwards. Following the completion of active mining, stockpiled lower-grade material will continue to be reclaimed to support processing through to Year 14.
The mine plan was developed using a 5 m × 5 m × 2.5 m block model. An inter-ramp slope angle of 54° was adopted for fresh rock on the hanging-wall side. The footwall slope follows the mineralised material geometry.
Drilling and blasting, loading, and haulage operations are planned to be fully outsourced. A mining dilution factor of 3% and a mining recovery of 97% were applied. The average Bond Ball Mill Work Index of the ore is 11.8 kWh/t. Explosive consumption rates of 200 g/t for mineralised material and 155 g/t for waste are expected.
Ore and waste haulage is planned using nominal 55 t payload trucks. Loading will be performed using hydraulic excavators in the approximately 75 t class.
Ore will be hauled either directly to the primary crusher or to the RoM and low-grade ore stockpiles. A wheel loader will be used to reclaim stockpiled ore when required. Waste will be hauled to three planned waste rock storage facilities, with material preferentially directed to the closest available destination. Mining in the southeastern portion of the pit is expected to be substantially completed by approximately Year 5 onwards. This may create an opportunity for partial in-pit placement of waste material, potentially reducing haulage requirements and the external waste-storage footprint. This opportunity would require confirmation through subsequent mine planning, geotechnical and environmental assessment.
The annual mining schedule (Table 10) was developed using an AuEq cut-off grade of 0.138 g/t and includes pre-stripping, RoM production, stockpile management and plant feed. Higher-value ore is preferentially processed during the initial years, while lower-grade material is stockpiled for processing later in the mine life. This scheduling strategy supports the economic optimisation of the project.
Figure 4: The final pit shell of the Cabaçal mine
| Year | Mining Schedule* | Stockpile Balance | Plant Feed | |||||||||||||||||||||||
|---|---|---|---|---|---|---|---|---|---|---|---|---|---|---|---|---|---|---|---|---|---|---|---|---|---|---|
| RoM Au Ag Cu Waste TM (Mt) g/t g/t (%) (Mt) (Mt) | VLG- Au Ag Cu S g/t g/t (%) (Mt) | LG Au Ag Cu (Mt) g/t g/t (%) | HG-S Au Ag Cu (Mt) g/t g/t (%) | VHG- Au Ag Cu S g/t g/t (%) (Mt) | PF Au Ag Cu (Mt) g/t g/t (%) | |||||||||||||||||||||
| PS | 2.57 | 0.31 | 0.77 | 0.28 | 7.71 | 10.28 | 1.82 | 0.10 | 0.64 | 0.22 | 0.51 | 0.29 | 0.96 | 0.39 | 0.11 | 0.68 | 1.15 | 0.52 | 0.13 | 3.13 | 1.56 | 0.56 | - | - | - | - |
| 1 | 5.94 | 1.05 | 1.46 | 0.41 | 6.56 | 12.50 | 4.49 | 0.10 | 0.61 | 0.21 | 1.83 | 0.34 | 1.10 | 0.37 | 0.08 | 0.59 | 2.48 | 0.62 | 0.17 | 3.13 | 3.76 | 0.94 | 1.93 | 2.80 | 2.69 | 0.71 |
| 2 | 5.75 | 0.74 | 1.98 | 0.46 | 7.07 | 12.82 | 7.30 | 0.10 | 0.66 | 0.21 | 2.53 | 0.30 | 1.44 | 0.41 | - | - | - | - | - | 4.63 | 4.76 | 1.04 | 2.50 | 1.72 | 3.41 | 0.76 |
| 3 | 4.44 | 1.07 | 1.69 | 0.44 | 7.75 | 12.19 | 9.66 | 0.10 | 0.65 | 0.21 | 2.11 | 0.29 | 1.52 | 0.42 | - | - | - | - | - | - | - | - | 2.50 | 1.86 | 2.60 | 0.64 |
| 4 | 4.61 | 0.87 | 1.60 | 0.42 | 7.32 | 11.93 | 11.83 | 0.10 | 0.65 | 0.21 | 0.05 | 0.28 | 1.54 | 0.43 | - | - | - | - | - | - | - | - | 4.50 | 0.97 | 2.04 | 0.52 |
| 5 | 5.13 | 0.55 | 1.52 | 0.39 | 7.78 | 12.91 | 12.51 | 0.10 | 0.64 | 0.21 | - | - | - | - | - | - | - | - | - | - | - | - | 4.50 | 0.61 | 1.67 | 0.43 |
| 6 | 4.18 | 0.51 | 1.16 | 0.34 | 7.49 | 11.67 | 12.19 | 0.10 | 0.63 | 0.21 | - | - | - | - | - | - | - | - | - | - | - | - | 4.50 | 0.48 | 1.14 | 0.33 |
| 7 | 4.90 | 0.38 | 1.23 | 0.32 | 7.31 | 12.21 | 12.59 | 0.10 | 0.64 | 0.20 | - | - | - | - | - | - | - | - | - | - | - | - | 4.50 | 0.40 | 1.26 | 0.33 |
| 8 | 6.23 | 0.38 | 1.29 | 0.31 | 6.37 | 12.60 | 14.32 | 0.10 | 0.64 | 0.20 | - | - | - | - | - | - | - | - | - | - | - | - | 4.50 | 0.47 | 1.52 | 0.37 |
| 9 | 5.99 | 0.58 | 0.90 | 0.26 | 5.14 | 11.13 | 15.80 | 0.11 | 0.62 | 0.19 | - | - | - | - | - | - | - | - | - | - | - | - | 4.50 | 0.73 | 1.08 | 0.31 |
| 10 | 6.30 | 0.27 | 0.85 | 0.21 | 8.82 | 15.12 | 17.61 | 0.11 | 0.61 | 0.18 | - | - | - | - | - | - | - | - | - | - | - | - | 4.50 | 0.32 | 0.95 | 0.25 |
| 11 | - | - | - | - | - | - | 13.11 | 0.11 | 0.61 | 0.18 | - | - | - | - | - | - | - | - | - | - | - | - | 4.50 | 0.11 | 0.61 | 0.18 |
| 12 | - | - | - | - | - | - | 8.61 | 0.11 | 0.61 | 0.18 | - | - | - | - | - | - | - | - | - | - | - | - | 4.50 | 0.11 | 0.61 | 0.18 |
| 13 | - | - | - | - | - | - | 4.11 | 0.11 | 0.61 | 0.18 | - | - | - | - | - | - | - | - | - | - | - | - | 4.50 | 0.11 | 0.61 | 0.18 |
| 14 | - | - | - | - | - | - | - | - | - | - | - | - | - | - | - | - | - | - | - | - | - | - | 4.11 | 0.11 | 0.61 | 0.18 |
| Total | 56.04 | 0.61 | 1.33 | 0.35 | 79.33 | 135.36 | 56.04 | 0.61 | 1.33 | 0.35 |
- 97% of recovery and 3% dilution was applied. PS: Pre-Strip, TM: Total Movement, VLG-S: Very Low-Grade Stockpile, LG-S: Low-Grade Stockpile, HG-
S: High-Grade Stockpile, VHG-S: Very High-Grade Stockpile PF Plant feed.
Table 10: Cabaçal mining schedule
Metallurgical Testing
The Cabaçal DFS project envisages that mined ore will be processed into copper concentrate containing payable quantities of gold and silver with deleterious elements well below the penalty threshold.
The beneficiation process is simple due to a clean mineralised material, with low impurities and an absence of organic material. This makes the mined material, at a 150 μm grind, amenable to flotation techniques, with the excellent auto-flotation characteristics of the Cabaçal mine's chalcopyrite. Gold is recovered via a gravity circuit concentrator and flotation with the copper. The rougher tailings are treated in a pyrite flotation stage, with the main objective of separating most of the sulphur into a low mass stream, reducing the risks associated with the final tails dewatering and disposal. Both tailings' streams are filtered for disposal. Rougher concentrate is reground and refloated in a cleaner and re-cleaner circuit, consisting of an IsaMill and a Jameson Cell, with the concentrate reporting to the dewatering circuit.
The Company has completed four phases of metallurgical test work since 2022.
First phase: In 2022, a new drilling campaign and test work programme was completed, based on ten metallurgical holes drilled by Meridian. Seven of these holes were used for sample selection to confirm historical performance with a new round of test work at SGS Lakefield, Canada. The holes provided samples from the four known main VMS systems, namely the Central Copper Zone, the Eastern Copper Zone, the Southern Copper Zone, and the Cabaçal Northwest Extension. Most of the samples were within the expected head grade range for the deposit. Comminution, gravity, and flotation tests were run on samples from different metallurgical domains, as well as on a master composite sample.
Second phase: In 2023, 23 variability samples from across the deposit (including nine through the vertical profile of drill hole CD-228) were collected, covering oxidised, transition and sulphide zones. Samples were tested at SGS Lakefield, Canada. In this programme, all samples were subjected to Bond ball mill work index and SMC testing. In addition, metallurgical samples were tested for flotation flowsheet and reagent dosage optimisation and, once the optimal flowsheet was defined, variability samples were tested to generate enough information to create recovery curves for the project.
Thickening and filtration tests were also performed.
Third phase: In 2024, a revised process flowsheet was developed with the main differences to the PEA flowsheet being:
The use of copper and gold specific collectors Aerophine 3148A and Aero 208 to replace PAX in rougher flotation;
An extended rougher float time; and
The flotation of pyrite minerals from the rougher tails for separate storage.
The new flowsheet was tested on the same samples and master composites selected for the PEA as well as additional samples that filled in gaps in the grade curve, represented the variability of the deposit from top to bottom and added data on the oxide and transition zones of the deposit.
In addition, a gold deportment study was conducted as well as TIMA-X mineral characterisation of the master composite. Tailings settling/thickener testing showed it responded well to BASF Magnafloc 155 flocculant.
Updated grade-recovery curves were developed at the completion of the test work.
Fourth phase: The test work performed in 2025 focussed on the DFS inputs and used drill core samples from the first five years of the mine plan - exceeding the projected payback period for the project. A total of 774 drill core intersections was sampled for this purpose. This plan had focussed deliberately on high gold grades so as to advance the cash flow of the project from startup. The composite Mini Pilot Plant mill feed graded 0.50% Cu, 0.92 g/t Au and 1.95 g/t Ag, with 0.83% S.
Test work included variability flotation of samples from each six-month period of the first 5 years of the mine plan, and a mini pilot plant run of mineralised feed from the first 5 years of the mine plan, to demonstrate scale and provide samples for other test work to fill gaps in the data for the DFS.
This sample material contained significant amounts of chlorite, in the range of 14.2 to 27.0%, an amount that would interfere with sulphide flotation by absorbing flotation reagent and destabilising the froth bed. This would impair the attainment of a high concentrate grade and optimal recovery of pay metals. Solutions to chlorite issues are well known and thus the flowsheet was adjusted to include increased levels of reagent dosing to overcome reagents absorbed by the chlorite and the addition of a re-cleaner circuit. This, combined with the dosage of CMC to depress the chlorite, plus the dosage of a mixed dithiocarbamate to enhance copper flotation, resulted in improved copper grades in concentrate as well as recoveries.
Mineral Processing
Based on the SGS test work results, the key parameters of the DFS's mineral processing findings were incorporated by Ausenco into the process plant design. These included:
Primary crushing capacity for 4.5 Mtpa at plant start up;
2.5 Mtpa mill capacity using a single-stage SAG mill designed with a conventional flowsheet for the first three years;
Comminution capacity is increased to 4.5 Mtpa with the addition of a ball mill from the fourth year onwards. Additional flotation cells, thickening and filtering capacity are also included in the expansion; and
Primary grind size of 150 microns with a regrind of the copper rougher concentrate to 30 microns.
Initially the process plant will process 2.5 Mtpa of run-of-mine ("RoM") feed from the Cabaçal open pit in the first three years, then with an expansion in year three of the plant operation, processing 4.5 Mtpa of RoM from the fourth year onwards. The process comprises crushing and grinding to reduce the RoM ore to a primary grind of 80% passing (k80) of 150 microns (µm). Approximately 30% of the mill feed is sent